top of page

Getting the first 1,000 subscribers is often considered the hardest part of growing a YouTube channel, but it's definitely possible. YouTube is the second most-visited site on the web, and we now spend up to 6 hours per day consuming video content. Considering that YouTube also has over 2 billion active users, there's still room for new channels to grow.


So, how long does it take to get 1000 subscribers on YouTube? Well, the average YouTube channel grows quite slow initially. Most channels take an entire year before they reach the 1000 subscriber milestone. See if you can accelerate the growth of your channel with the following tips.


YouTube SEO

The basics of YouTube SEO are no different from web SEO.

  1. Optimize the video titles and descriptions for your target keywords. A lot of the repeated advice is to keep titles under 70 characters in length. This is because that's the maximum that is displayed without the text being truncated.

  2. Regularly check YouTube analytics. In addition to researching target keywords, check the search queries for your existing videos, in the Analytics tab in YouTube Studio This can give you inspiration for new target keywords that you hadn't thought about.

  3. Include your target keyword in the video file name before uploading it. Don’t use spaces between each word, but rather hyphens or underscores. 

  4. Add relevant tags to each video. While most users don’t use tags to find videos, they can help the YouTube algorithm categorize your video and serve it to the appropriate audience. Keep it under 5-8 industry tags to avoid being flagged as spam. There are actually two places to add tags. The first is under Video details > Advanced Settings > Tags. The second is by simply including hashtags in the video description.

  5. Add your video category to each video. While not as specific as tags, categories also help the YouTube algorithm understand what your video is about, and help users find your video.

  6. After you've built up your video catalog for awhile, organize your content into playlists. This is  great for SEO and viewer engagement, leading users deeper and deeper into your content and increasing the chance they subscribe.


Promotion

Don't even think about promotion until you have uploaded at least 10 videos. If you only have a few videos, the YouTube algorithm is still learning your channel and audience. So the more data you give YouTube, the more likely that the algorithm puts your videos in front of relevant viewers' eyes. 


Once you're ready, start by cross-promoting on your personal website, Twitter, Instagram, Reddit, or Facebook groups. On the YouTube side, you'll need to first complete a one-time verification before you can include clickable links in the video description.


Video Quality

The aforementioned tips only matter if you're committed to producing high-quality videos. Watch through the finished product with a critical mindset. 


You don't need to be a professional filmmaker or editor, but keep some basic guidelines in mind when recording.

  • If possible, outdoor light is usually better than indoors. If it's late at night, find somewhere with the most light to record.

  • Beware of background elements that just add visual clutter.

  • If you're filming people (either yourself or others), don't cut off heads at the neck or feet at the ankles. Either move in closer or back wider.


For your first 20-30 videos, aim to try something new each time. Experiment with the background music, camera angle, theme, length, etc. of your videos and see what works. You'll know that you've got it right when you start getting an influx of views via browse instead of search.


Note that videos as short as 1 minute can be monetized, but the optimal length to ensure a high ROI is around at least 8 minutes.


Monetization

YouTube needs a critical mass of videos and subscribers before they can make an informed judgment of whether your channel meets the monetization policies. But once your channel hits 1,000 subscribers, it's eligible for the YouTube Partner Program. This means that you can monetize your video and earn income from ads. The other requirement is getting 4,000 hours of watch time in the past 365 days or 10 million public Shorts views in the past 90 days.


Before getting started with your ads account, read through the YouTube Community Guidelines and monetization policies.


Curious about your favourite channels? This site estimates how much revenue a monetized video has made: https://isthischannelmonetized.com/

AB testing, one of the simplest forms of a randomized controlled experiment, is basically a way to compare two versions of something to figure out which performs better. These days it’s most often associated with websites and apps. Digital marketing teams can use AB testing to answer questions like which subject line is more likely to get subscribers to open a promotional email, or which image on your website is more likely to get clicked. 


Null and Alternative Hypothesis 

Before testing, the first crucial step is to clarify your null and alternative hypotheses. The null hypothesis tends to be a statement that your change actually had no effect. For example, your average email open rate was previously 20%, and remains at 20% even after updating the email subject line. Any sample observations resulted purely from chance. The alternative hypothesis would be that your average email open rate is now greater than 20% after the change, influenced by some non-random factor.


Calculate the Required Sample Size

In short, the larger the sample size, the better. Larger sample sizes allow you to be more certain that your test results are truly representative of the overall population. 


There are many online tools available such as this one, to calculate your required sample size. You’ll need to prepare the following inputs.

  • Significance Level: the probability that your result could have occurred by chance, usually set to 5% and denoted by the Greek letter α

  • Power: the probability of correctly rejecting the null hypothesis when it is false, usually set to 80%.

  • Baseline Conversion Rate: the current or expected percentage of recipients who will perform the desired action, such as opening an email or clicking on a link.

  • Minimum Detectable Effect (MDE): The smallest difference between the two versions of the emails that you are willing to detect, expressed as a percentage of the baseline conversion rate.

MDE = (desired conversion rate lift / baseline conversion rate) x 100%

Replace “conversion rate” with another metric such as open rate or click thru rate, as needed. For example, if your current average CTR is 5% and the smallest difference that you want to detect is 0.5 percentage points, then your minimum detectable effect is 0.5/5 = 10%.

If you have more than 50,000 subscribers, Salesforce recommends sending to 5% per condition. For example, if your subscriber base is 100,000 and you plan to run a standard AB test to compare 2 different versions of content, you may send version A to 5,000 randomly selected subscribers and version B to 5,000 different subscribers. If you have less than 50,000 subscribers, Salesforce recommends using 10%. If you have a small audience (say, fewer than 500 subscribers) your results may not be statistically significant.


AB Testing in Salesforce Marketing Cloud

This section will briefly cover the best practices when rendering an AB test in Salesforce Marketing Cloud. Other CRM tools may have similar functionality. 


AB test for the following elements is available directly in Email Studio: subject line, email, content area, from name, send time, and preheaders. Here, you may also set the criteria to determine the winning email automatically, as either the version with highest unique open rate, or the version with the highest unique CTR.


Email Studio also allows users to define the test distribution, based on either the number of subscribers (i.e. 40 to receive version A, 60 to receive version B) or percentage of subscribers (i.e. 35% to receive version A, 65% to receive version B). The system then randomly splits contacts in the group, according to the user-defined parameters. Note that users cannot control placing a specific subscriber in one distribution or the other.


For more advanced AB tests with 2-10 paths, use the Path Optimizer Test activity in Journey Builder. This is a multi-variant testing tool for testing content, send frequency etc. Once a winner is chosen, either automatically by the system or manually by the user, the winning path will continue to receive new contacts while the losing path(s) will stop taking in new contacts, allowing for journey optimization. The Path Optimizer test activity also provides test summary analytics, including historical test context for decision making.


When using Journey Builder for AB tests, consider including a Validation activity as well. Validation confirms that the journey's components are working correctly, by checking for errors or configuration issues in the following activities: entry source, entry schedule, decision splits, wait activities, update contact activities, email engagement splits, journey settings, journey goals and exit criteria.


Don't forget that although you are AB "testing", the emails are still being sent to real subscribers. Promotional emails should always comply with CAN-SPAM requirements and Marketing Cloud's Anti-Spam policy.


Finally, note that if your AB test involves email open rates, note that Apple’s Mail Privacy Protection released in September, 2021 may cause your open rate data to be inflated and skew results. 


How to Measure Statistical Significance

Statistical significance measures how likely it would be to observe what was observed, assuming the null hypothesis is true. In other words, statistical significance means that if you were to run the test again, you should get the same result. There are actually two ways to determine whether your test results are statistically valid.


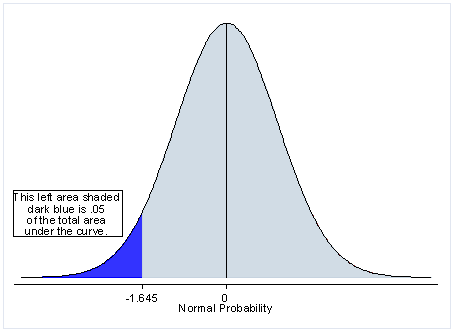
One-tailed test
Two-tailed test

One-tailed tests (top image) allow for the possibility of an effect in one direction, and show evidence if the variation is better than the control. In a one-tailed test, the null hypothesis is that the variation is not better than the control, but could be worse. The two-tailed test (bottom image) allows for the possibility of either a positive or negative effect, and shows evidence if the variation and control are simply different. 


In the real world, I generally go with a two-tailed test for most cases of AB testing. I often don’t know the direction of difference in key metrics, and it’s totally possible that the new variation performs worse. One-tailed test may also be fine if you’re testing a new variation and only want to know whether it is better than the control or not. If you don’t plan to deploy the new variation if it doesn’t win, then there is no problem. However, there could be a problem if there is no statistically significant winner and you deploy the new variation by assuming that it didn’t perform worse.


Assuming that AB tests for digital marketing have large sample sizes, use z test to analyze the results. Under the Central Limit Theorem, the sample is expected to have a normal distribution, and you don't have to worry about normality. In my experience, most people don't actually check the sample distribution if they have reasonable confidence that the assumptions for using z test are true. To determine the statistical significance of your completed AB test, check the following values.


  • Z score: how many standard deviations away from the mean your result lands, in a normally distributed sample.

Z score = (Data Value - Mean) / Standard Deviation
  • Standard error: the standard deviation of a sample population, used to measure the accuracy with which the sample represents the whole population.

Standard Error = SQRT {P*(1-P) / Sample Size}
Standard Error = Standard Deviation / SQRT(Sample Size)
  • P value: the probability of getting your result, assuming that the null hypothesis is true. Use the following Excel function to find the p value from z score.

= NORMDIST(z score, mean, standard deviation, cumulative)

* mean: the mean of the distribution, use 0 for standard normal distribution

* standard deviation: use 1 for the standard normal distribution

* cumulative: "FALSE" returns the probability density function, the probability distribution of a continuous random variable;  "TRUE" returns value of the cumulative distribution function, the probability distribution of both discrete and continuous random variable


If the p value is less than your significance level, reject the null hypothesis. It means that there’s sufficient evidence of the alternative hypothesis. Otherwise, fail to reject the null hypothesis.


Type I and Type II Errors

Type I error is a false positive, meaning that you falsely concluded that any variation of an AB outperformed the other(s) with statistical significance. The probability of a Type I error is the significance level of your AB test. So if your test result has 95% confidence level, your probability of a Type I error is 5%. 


Type II error on the other hand, implies a false negative. In other words, Type II error falsely concludes that there is no statistically significant difference between the variations in your AB test, when there actually is a difference. Type I and Type II errors have an inverse relationship - by increasing your confidence level, the probability of Type I error decreases, and the risk of a Type II error increases. 


Many organizations view AB test outcomes as trustworthy enough to influence their business decisions. It's generally not necessary to repeat a test, unless something went wrong or the environment has changed. So when running AB tests, always record not only the test results, but also the environment that you ran it in - what was the state of any relevant elements of your product and customers? 


Limitations of AB Tests for Email Marketing

The biggest limitation is probably that AB testing looks at dependent variable results without considering the interactions of independent variables, so you can only make one change at a time. If you don't have enough time to test this way, or you're changing multiple variables and want to know more about which change mattered, it's time to look at multivariate testing instead. Multivariate testing is a more complex version of traditional AB testing. With multivariate testing, you can investigate further into the interactions of multiple independent variables on the target dependent variable.


Finally, an abstract point to end this post... as long as humans are conducting data analysis, there will be some level of cognitive bias involved. In layman's terms, the Dunning Kruger Effect means that "the less competent you are, the more confident you tend to be." Basically, people who are unskilled suffer a dual burden: they tend to reach erroneous conclusions and miss key insights, and on top of that, their incompetence robs them of the metacognitive ability to realize it in the first place.

Posted: June 23, 2021

Updated: July 22, 2022


1. Separate URLs into their Components

To separate URLs into their components, such as for analyzing a sitemap or site structure, go to the data menu in google sheets → split text to columns, and then choose "/" as the separator. Alternatively, use the split formula.

=SPLIT(A1,“/”,true,true)

2. Users' Browser Window Widths

This is useful when creating a new landing page. Get the browser size (both width and height) in Google Analytics, and then export that data to Google Sheets to see the distribution of browser window widths. I first learned about this in a blog post from 2018, and have used it regularly. It's a bit old but still works the same: How to make a chart of your users' window sizes.


3. Ad Spend Tracker

When managing PPC campaigns, I usually setup a quick Google Sheet to track the monthly ad spend and make sure that I'm spending the budget evenly.

=DAY(TODAY())/DAY(DATE(YEAR(NOW()),MONTH(NOW())+1,0)) 

4. Regression Analysis for SEO Forecasting

Regression analysis is a common technique for understanding how a dependent variable such as organic traffic, changes in relation to independent variables such as search volume. Start with the built-in forecasting tools such as XLMiner Analysis ToolPak for Google Sheets, and then experiment with other statistical models such as multiple linear regression to see which one fits best. If you have trouble formulating a statistically significant model, try adding other important factors such as the page's publish date or number of high-quality backlinks.


5. Google Ads and Google Analytics add-ons

Google Sheets has a built-in Google Ads add-on that can pull campaign data. It's a bit buggy but good enough for ad hoc analysis. Similarly, there is also a Google Analytics add-on that you can use to pull data, modify as needed (such as fixing historical data) and export to Data Studio.


6. Identify SEO Issues

Import the html of pages in your site and checking for things like missing h1, title, meta tags, image alts, etc. Use the IMPORTXML function to scrape structured data from webpages, then use XPath query to specify which part of the XML to extract.

Some basic XPath queries:

  • //h1 - to scrape h1s

  • //title - to scrape titles

  • //@href - to scrape links

.

Other common XPath queries for SEO:

  • //meta[@name='description']/@content - to scrape meta description

  • //link[@rel=’canonical’]/@href - to scrape canonicals

.

An example for JavaScript elements:

  • //script[contains(.,'gtm.js')] - to scrape (check for) GTM code

.

7. Find & Replace with RegEx

RegEx (regular expression) is a sequence of characters to define a search pattern, often used for cleaning and manipulating data. It is available in Google Sheets find and replace, as well as many programming languages.


For example, BigQuery uses SQL and also supports RegEx as well, allowing users to write simpler code and avoid complicated subqueries.


In standard SQL, the query below extracts the substring between two parentheses.

substr (column, instr (column, '(')+1,instr (column, ')') instr(column '(')-1)

In ReGex, it can be rewritten as follows.

regex_extract (column, r'/((.*)')---

---

The remaining examples use Apps Script, which mostly runs on JavaScript 1.6, with some additions from 1.7 and 1.8. So you’ll need some JavaScript knowledge to edit the script and link it to Google properties, but not to the level of app or web development.


8. Confirmation Emails

Although Google Forms already has an option to send a standard confirmation email, Google Apps Script allows for further customization - send different confirmation emails depending on the user's responses, add external links, etc. This post by Google Workspace for Developers offers an in-depth explanation.


9. Redirect Chains

Ensure all pages on your site are accounted for with the following script.

// Get destination urls including redirects

function getRedirects(url) {
  var params = {
    'followRedirects': false,
    'muteHttpExceptions': true
  };
  var followedUrls = [url];

  while (true) {
    var res = UrlFetchApp.fetch(url, params);
    if (res.getResponseCode() < 300 || res.getResponseCode() > 399) {
      return followedUrls;
    }
    var url = res.getHeaders()['Location'];
    followedUrls.push(url);
  }
}

function getDestination(url) {
  return getRedirects(url).pop();
}

10. http Server Status Code

Track the status code of all pages on your site with the following script.

// Get http server response status code
function getStatusCode(url){
  var options = {
     'muteHttpExceptions': true,
     'followRedirects': false
   };
  var statusCode ;
  try {
  statusCode = UrlFetchApp .fetch(url) .getResponseCode() .toString() ;
  }
  
  catch( error ) {
  statusCode = error .toString() .match( / returned code (\d\d\d)\./ )[1] ;
  }

  finally {
  return statusCode ;
  }
}

// Exceed importxml limit
function importRegex(url, regexInput) { 
  var output = ''; 
  var fetchedUrl = UrlFetchApp.fetch(url, {muteHttpExceptions: true}); 
  if (fetchedUrl) { 
    var html = fetchedUrl.getContentText(); 
    if (html.length && regexInput.length) { 
      output = html.match(new RegExp(regexInput, 'i'))[1]; 
    } 
  } 
  Utilities.sleep(1000); 
  return unescapeHTML(output); 
}  

For more resources, keywords in sheets has free scripts for SEO. There are different templates for tasks such as getting old webpages from wayback machine, SEO forecasting and clustering.

bottom of page